Charts to Understand AI: November 2026
James Gross · November 2, 2026
Charts on AI capacity, spending, adoption, and work, with historical comparisons, source notes, and data periods from Alephic’s November 2026 edition.
The supply of AI compute keeps expanding
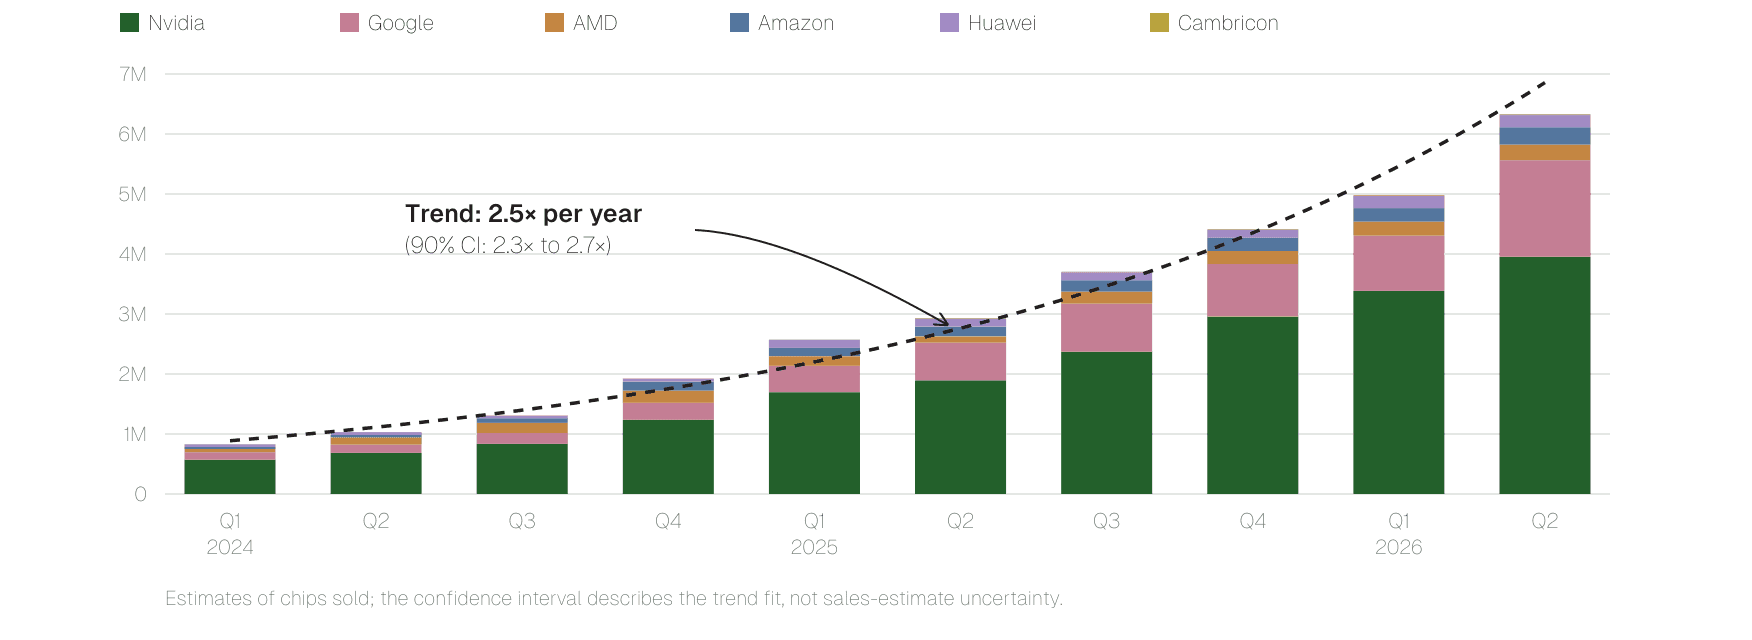
Epoch AI · Isabel Juniewicz and Josh You · Q1 2024–Q2 2026; published October 29, 2026
Inside this edition
Research on AI infrastructure, model economics, adoption, and work. Browse the featured charts below or explore the full collection, with sources and data periods throughout.
This edition draws on research published or captured through October 31, 2026. Underlying data range from historical comparisons to 2026 observations, estimates, and surveys. Charts retain their source periods. Some are restyled from underlying data; others reproduce or approximate published chart geometry. Each source has its own population and methodology, so the charts should not be combined into a single index. Alephic's commentary is interpretation, and the original researchers remain the sources of the data.
Published .
Capacity & cost
Compute supply, geography, and model costs.
The supply of AI compute keeps expanding
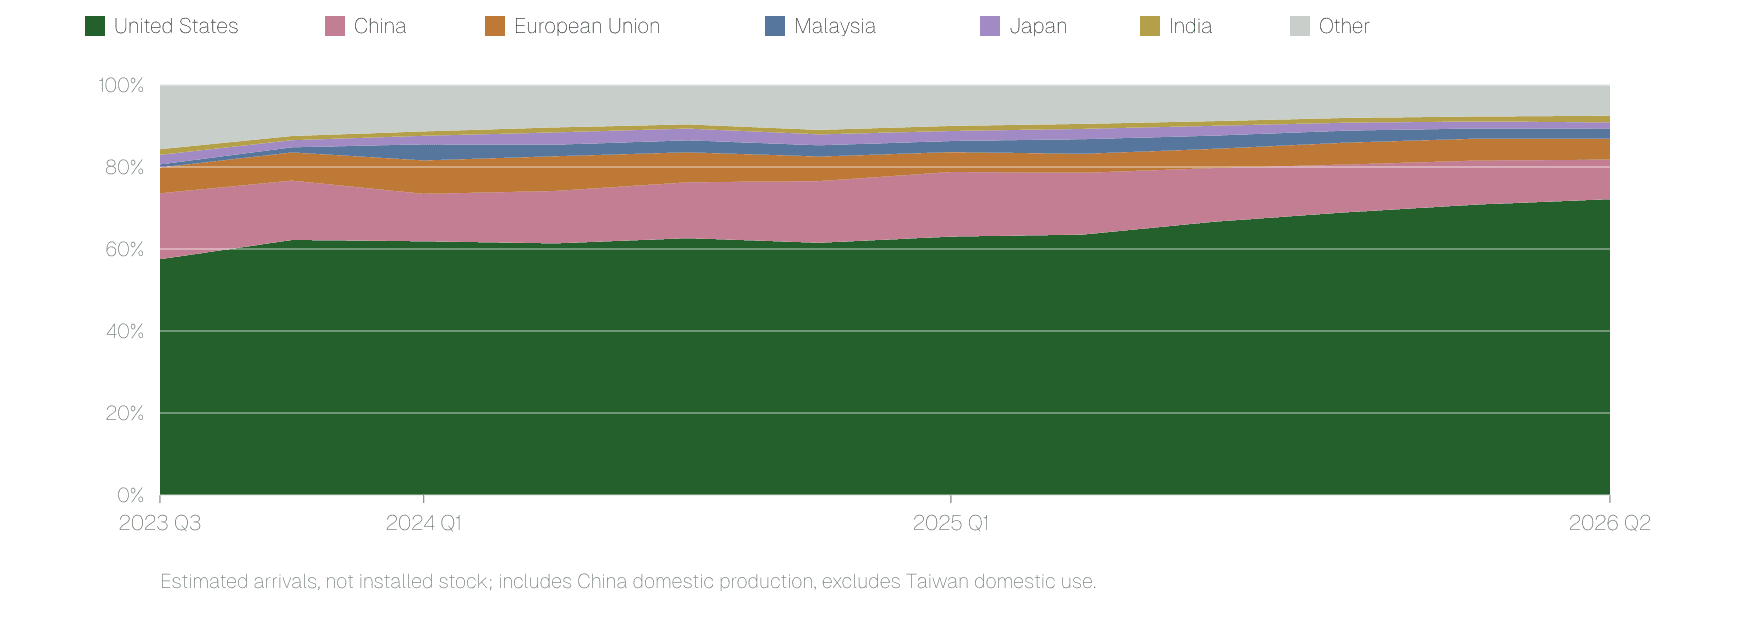
Epoch estimates quarterly AI chip capacity sold rose from 0.8 million to 6.3 million H100-equivalents between Q1 2024 and Q2 2026.
Epoch AI · Isabel Juniewicz and Josh You
Estimates of chips sold by six major designers, not installed or active capacity. H100-equivalents normalize theoretical compute. The fitted historical rate is not a forecast. Adapted under CC BY.
The chart collection
Explore the 15 featured charts and 24 supporting charts. Select any chart to inspect it at a larger size.
39 charts